The Marketing of Innovation

Overview

Design thinking, research, and the nuances of how new products are adopted by marketplaces.

Presented by:
Larry Vincent,
Professor of the Practice of Marketing
Presented to:
GSBA 509
September 29, 2026

Design thinking
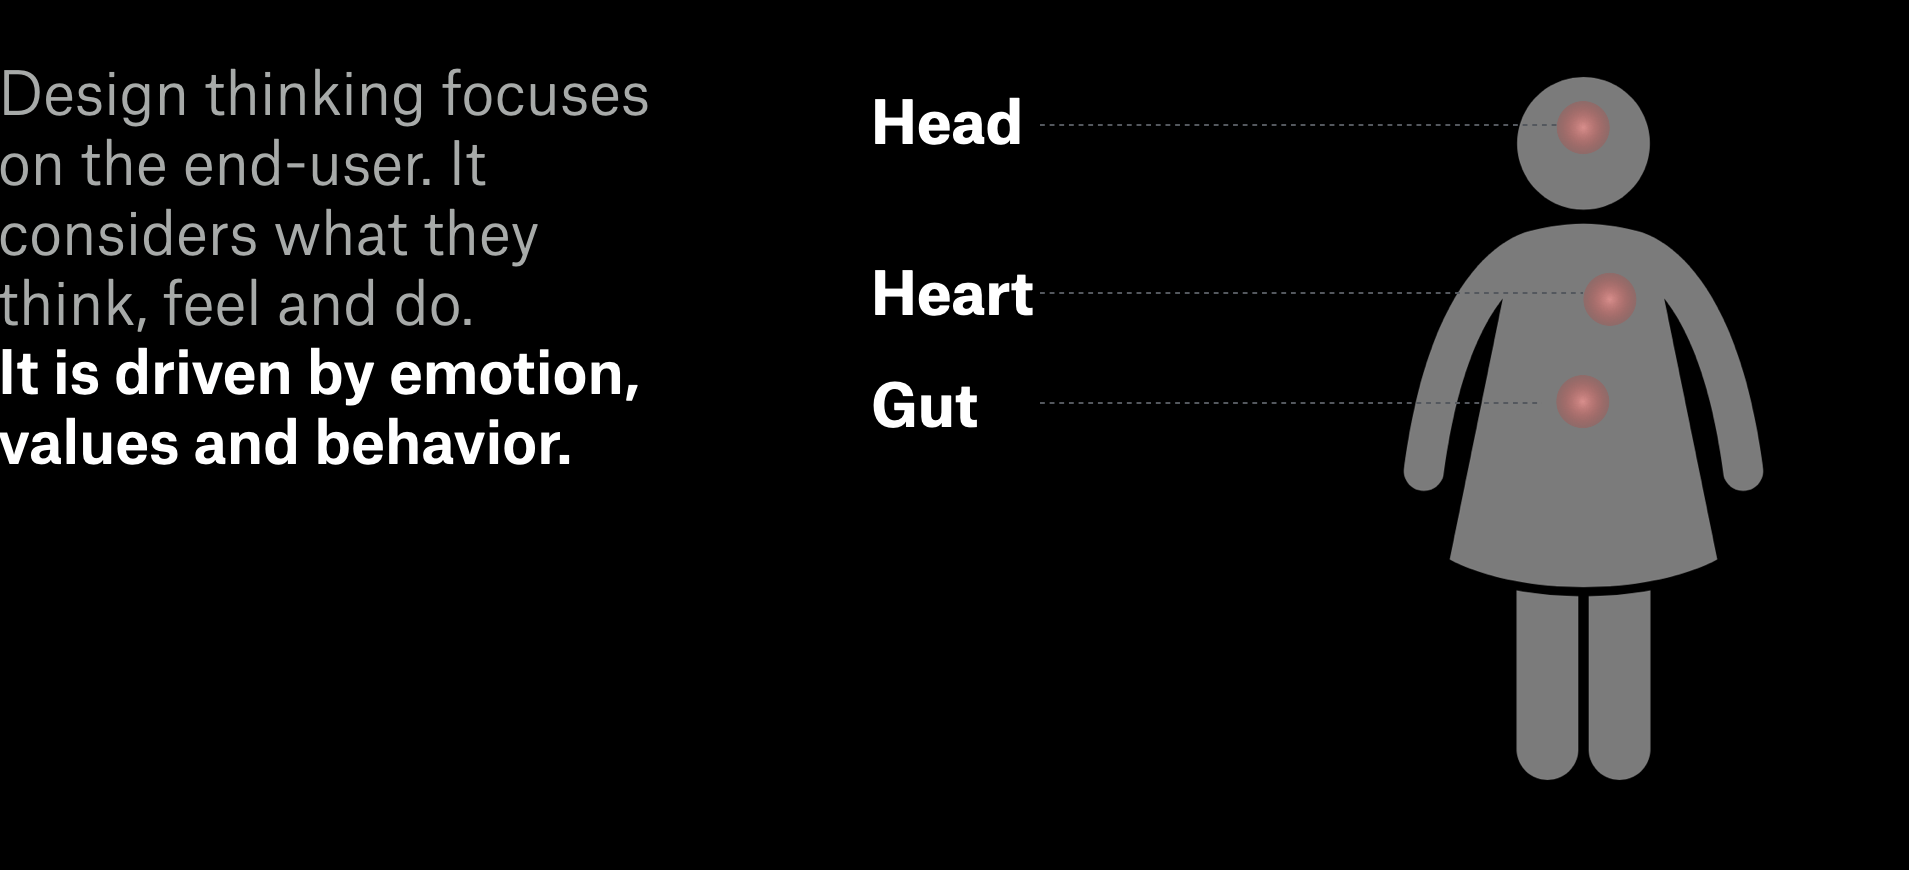
Design thinking

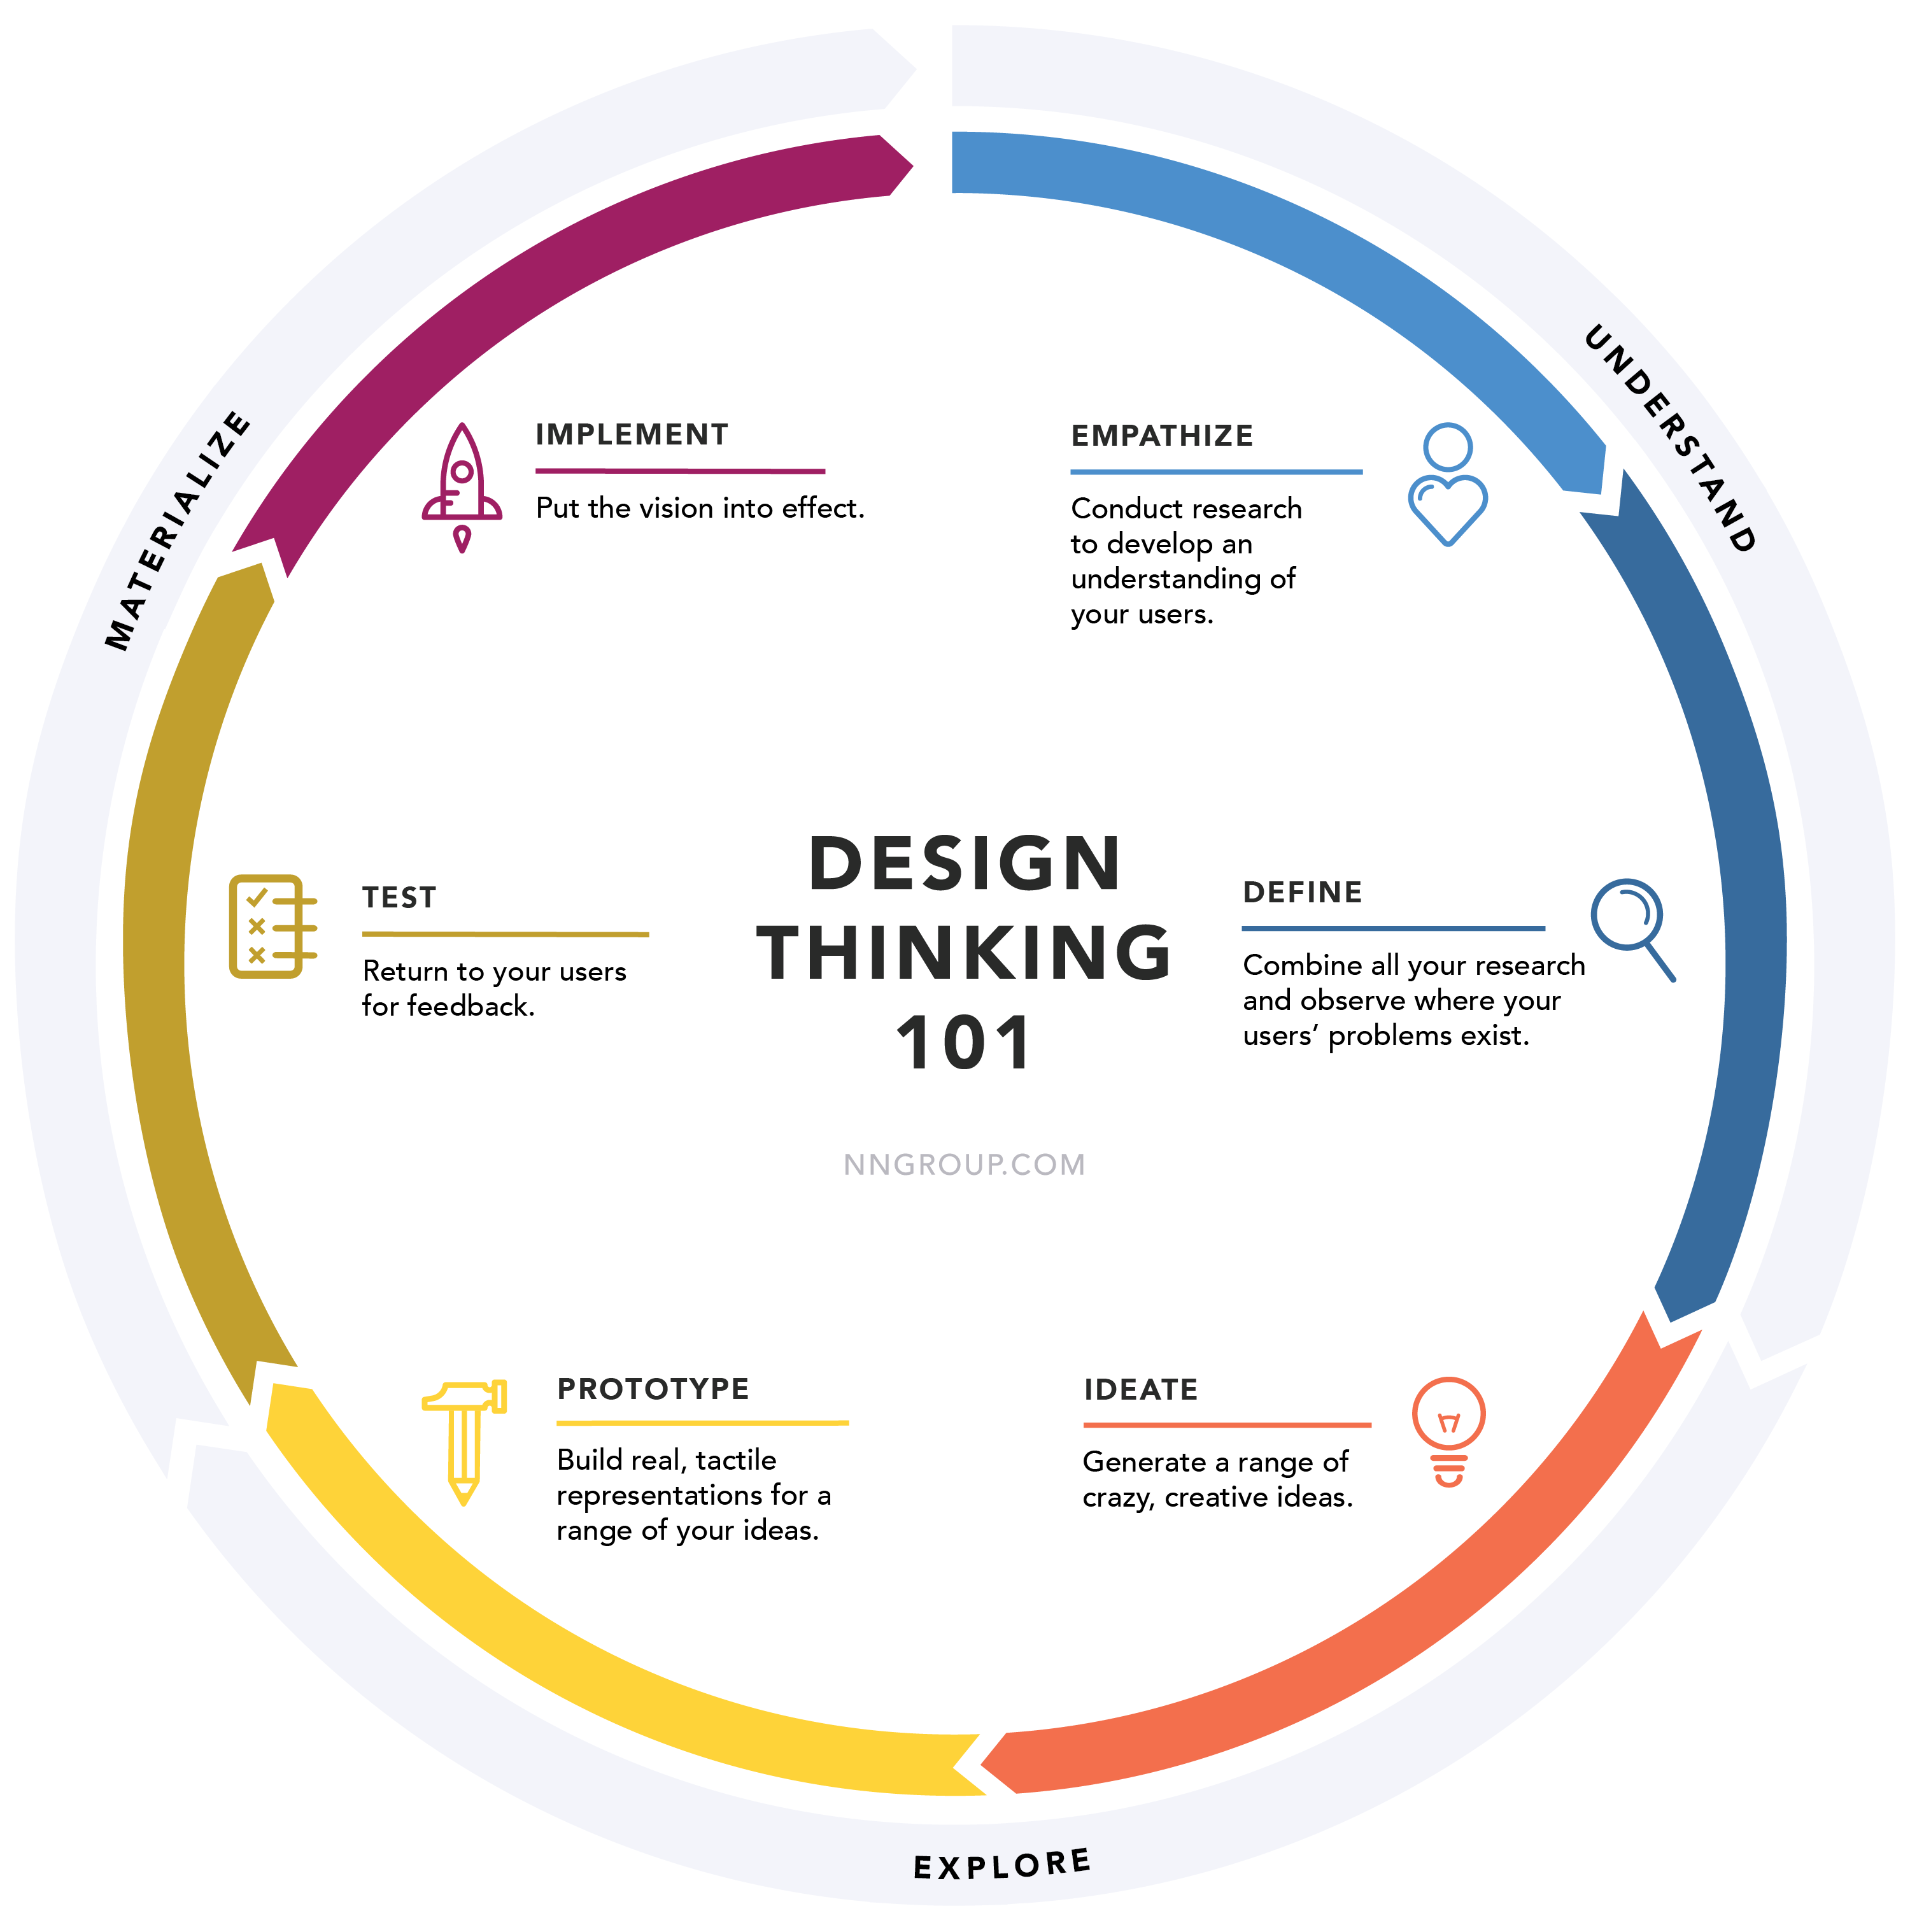
Design thinking process
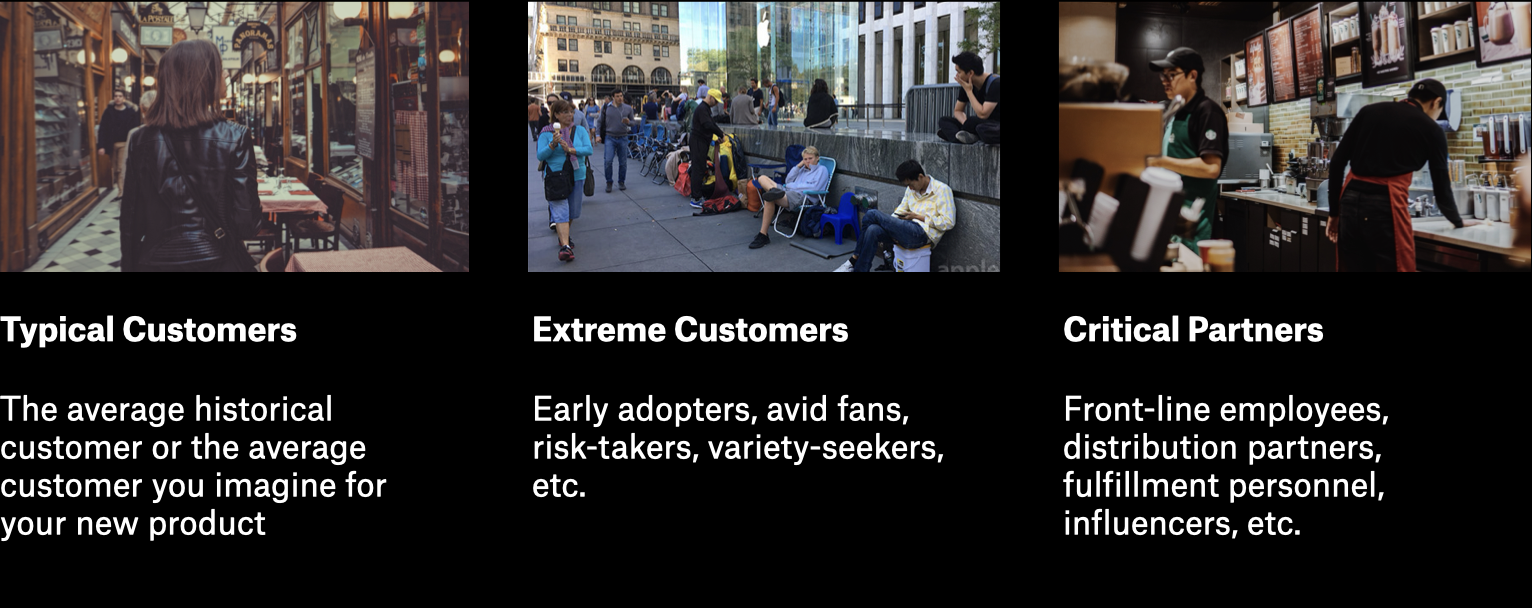
Who to study…
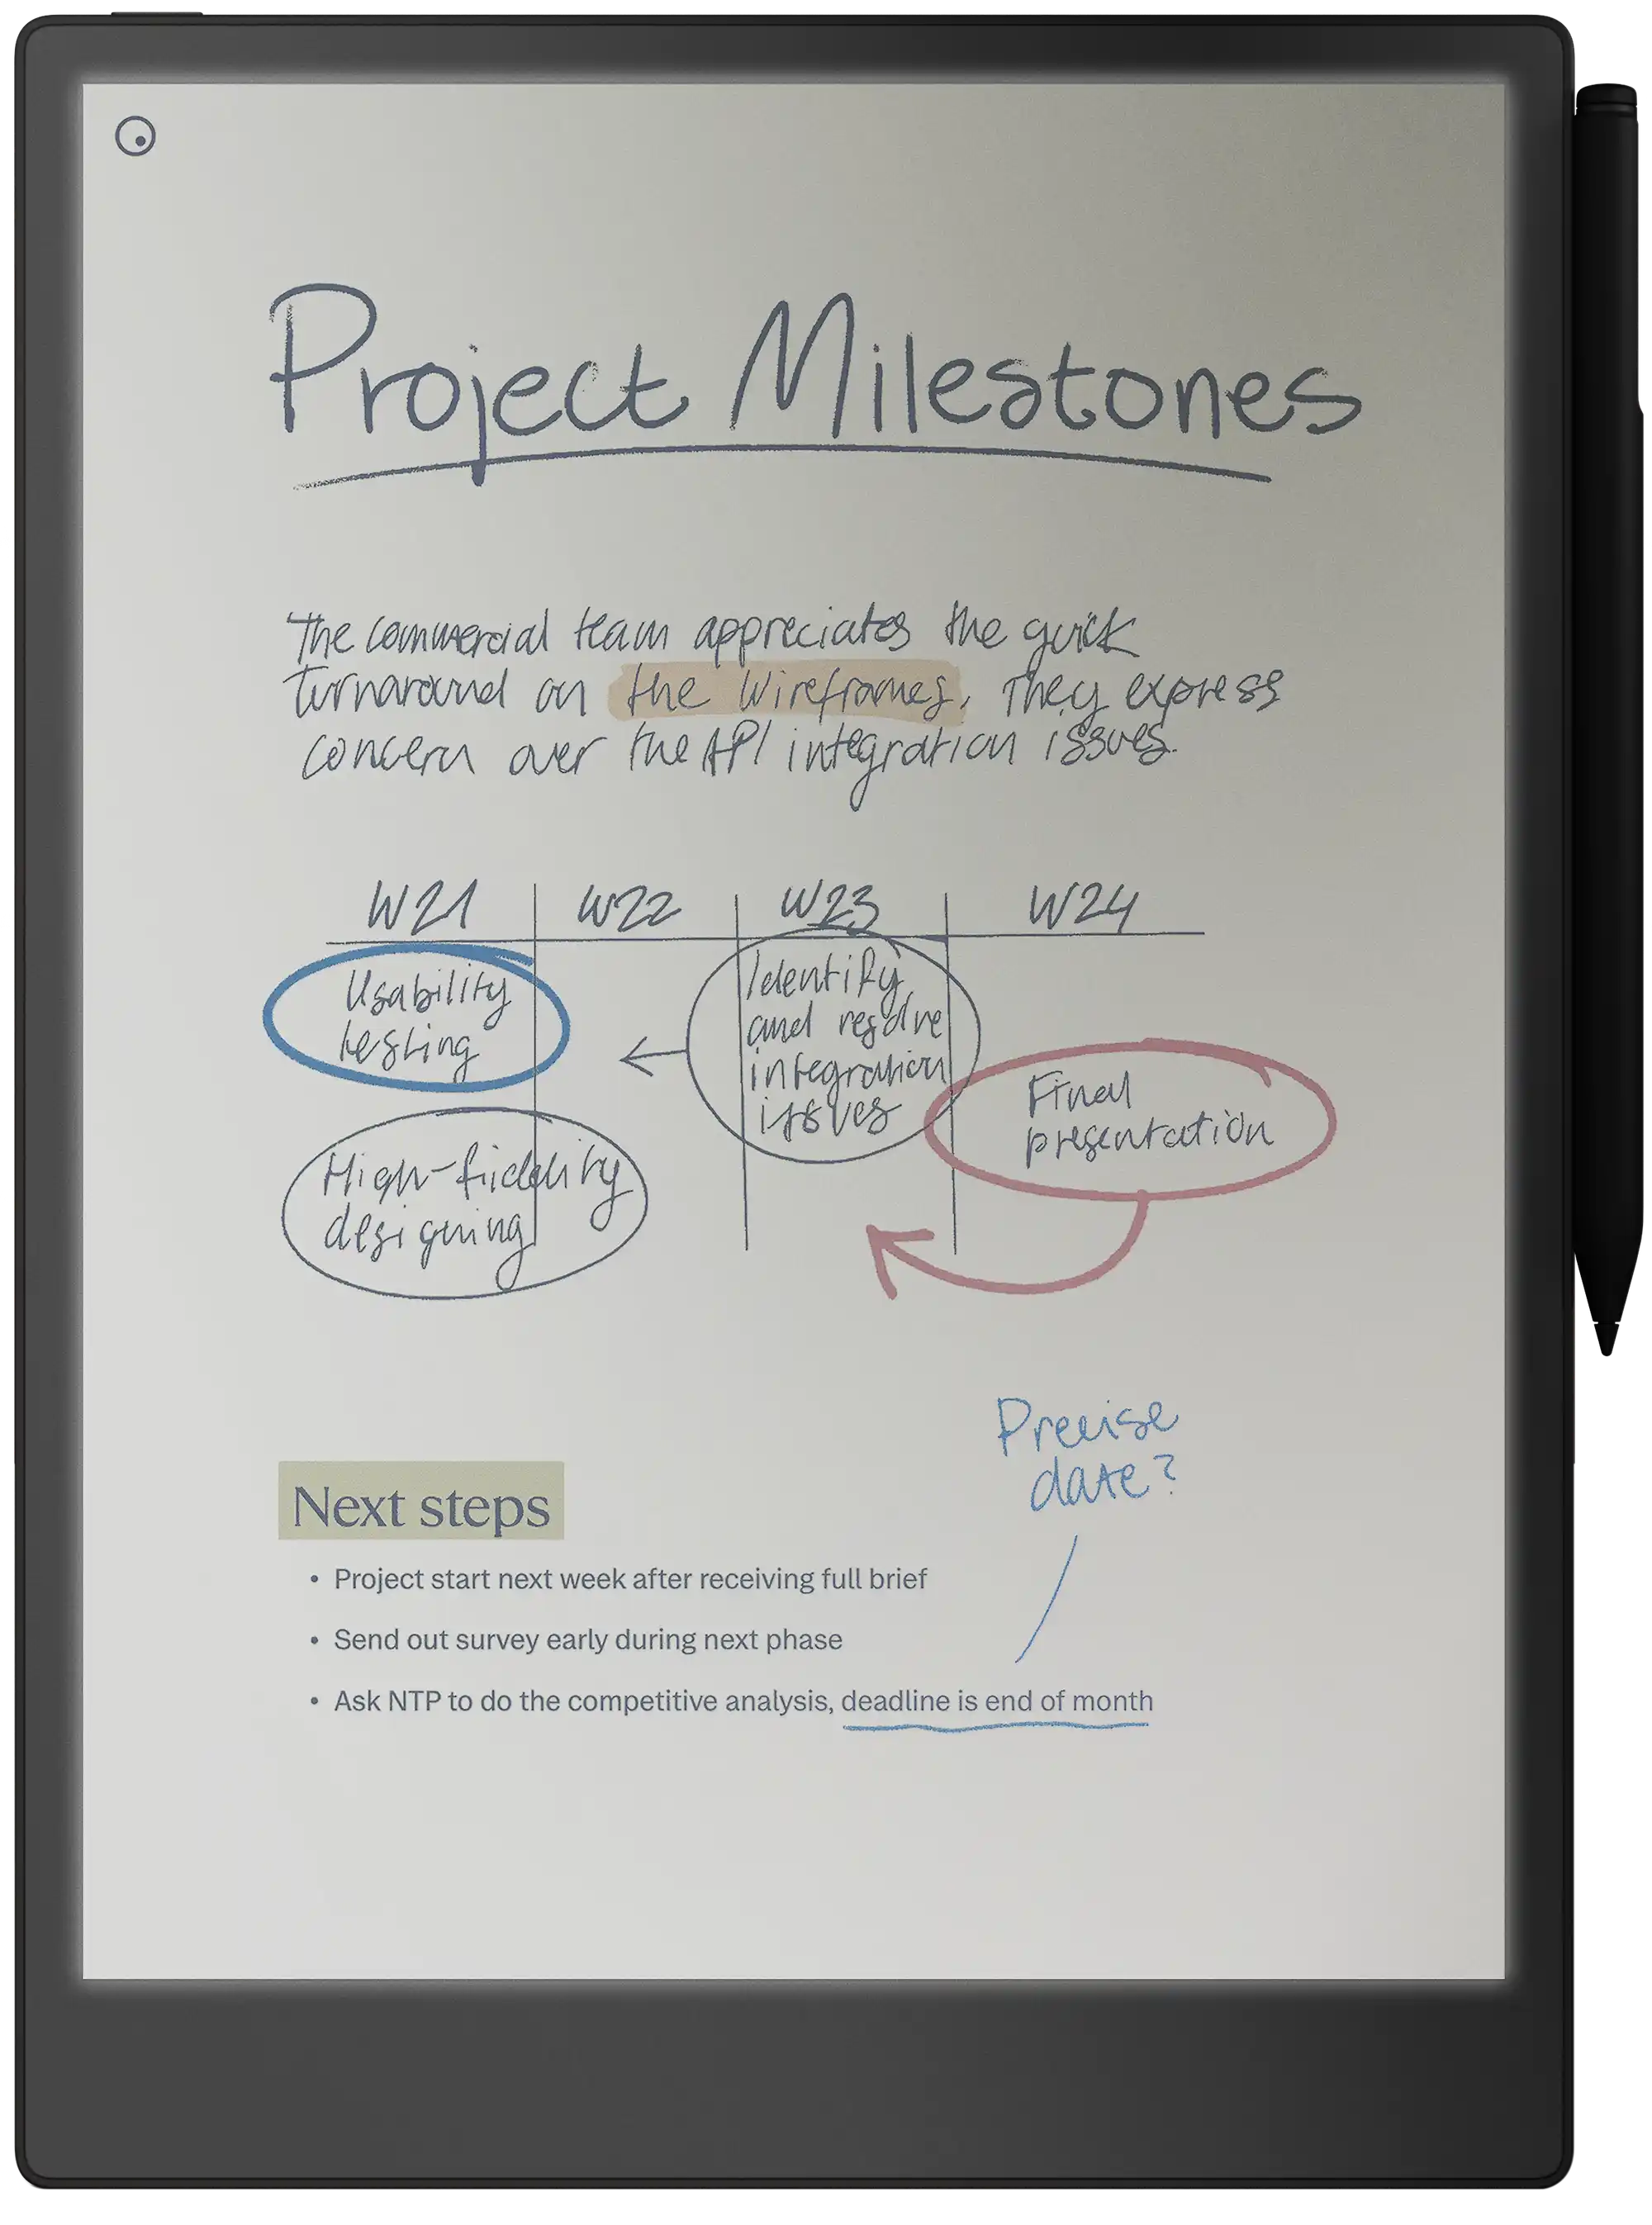
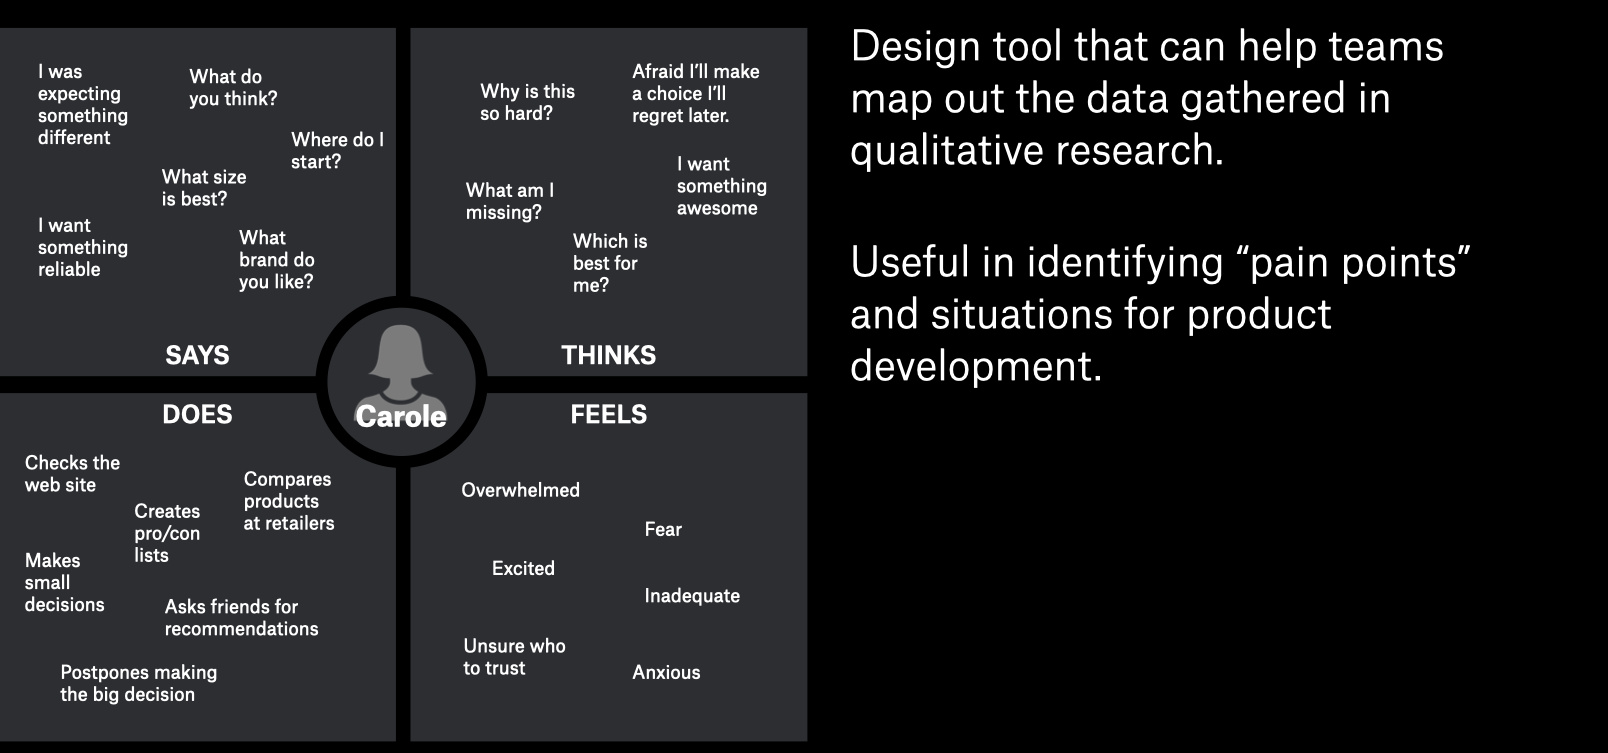
Empathy maps
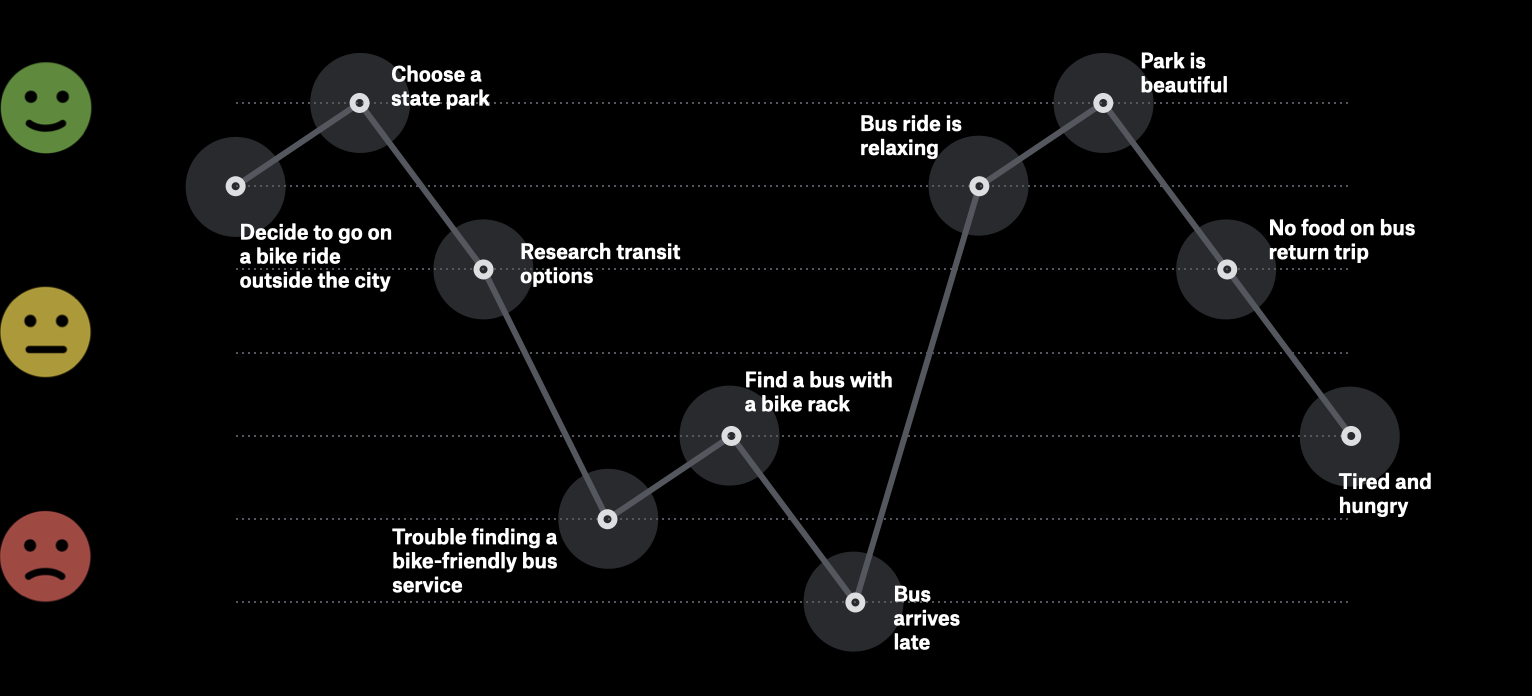
Journey mapping
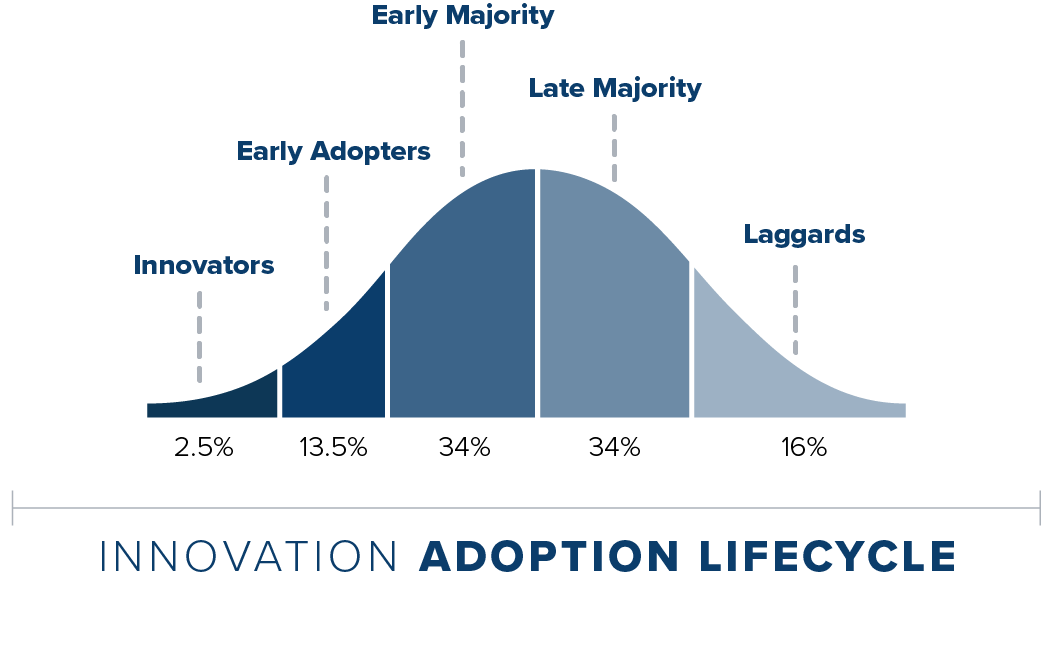
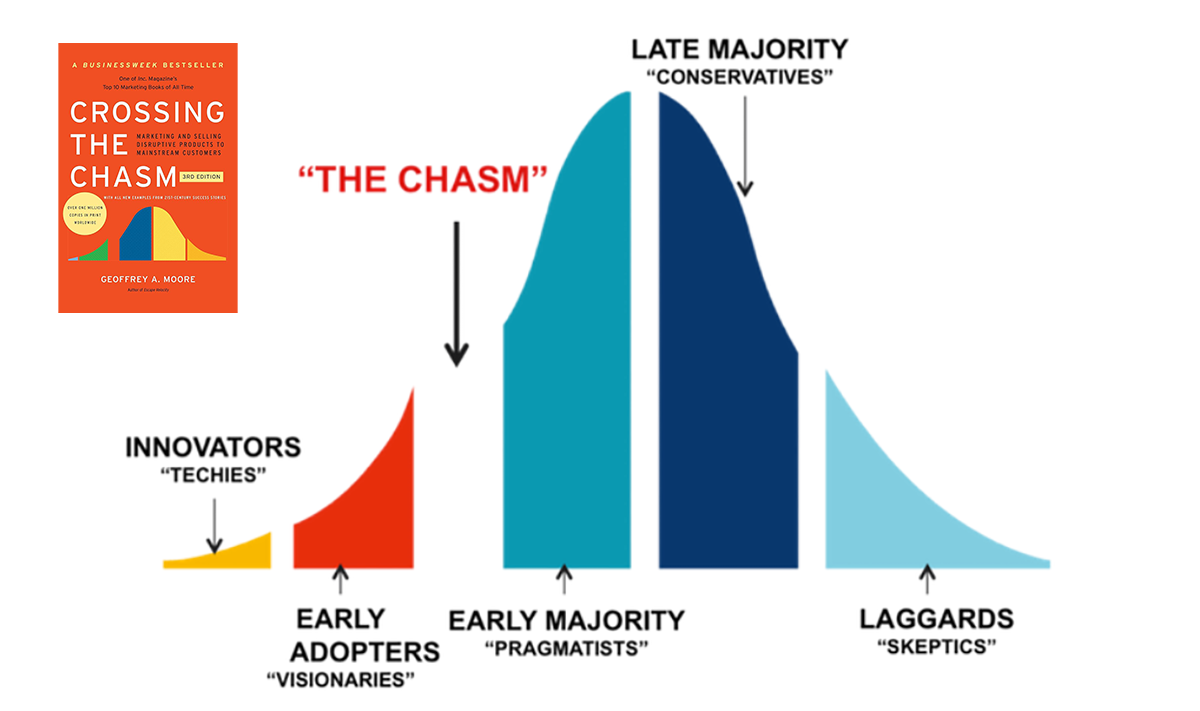
The diffusion and adoption of innovation

Diffusion of innovation

Source: Diffusion of Innovation, Everett Rogers, 1962.

Crossing the chasm
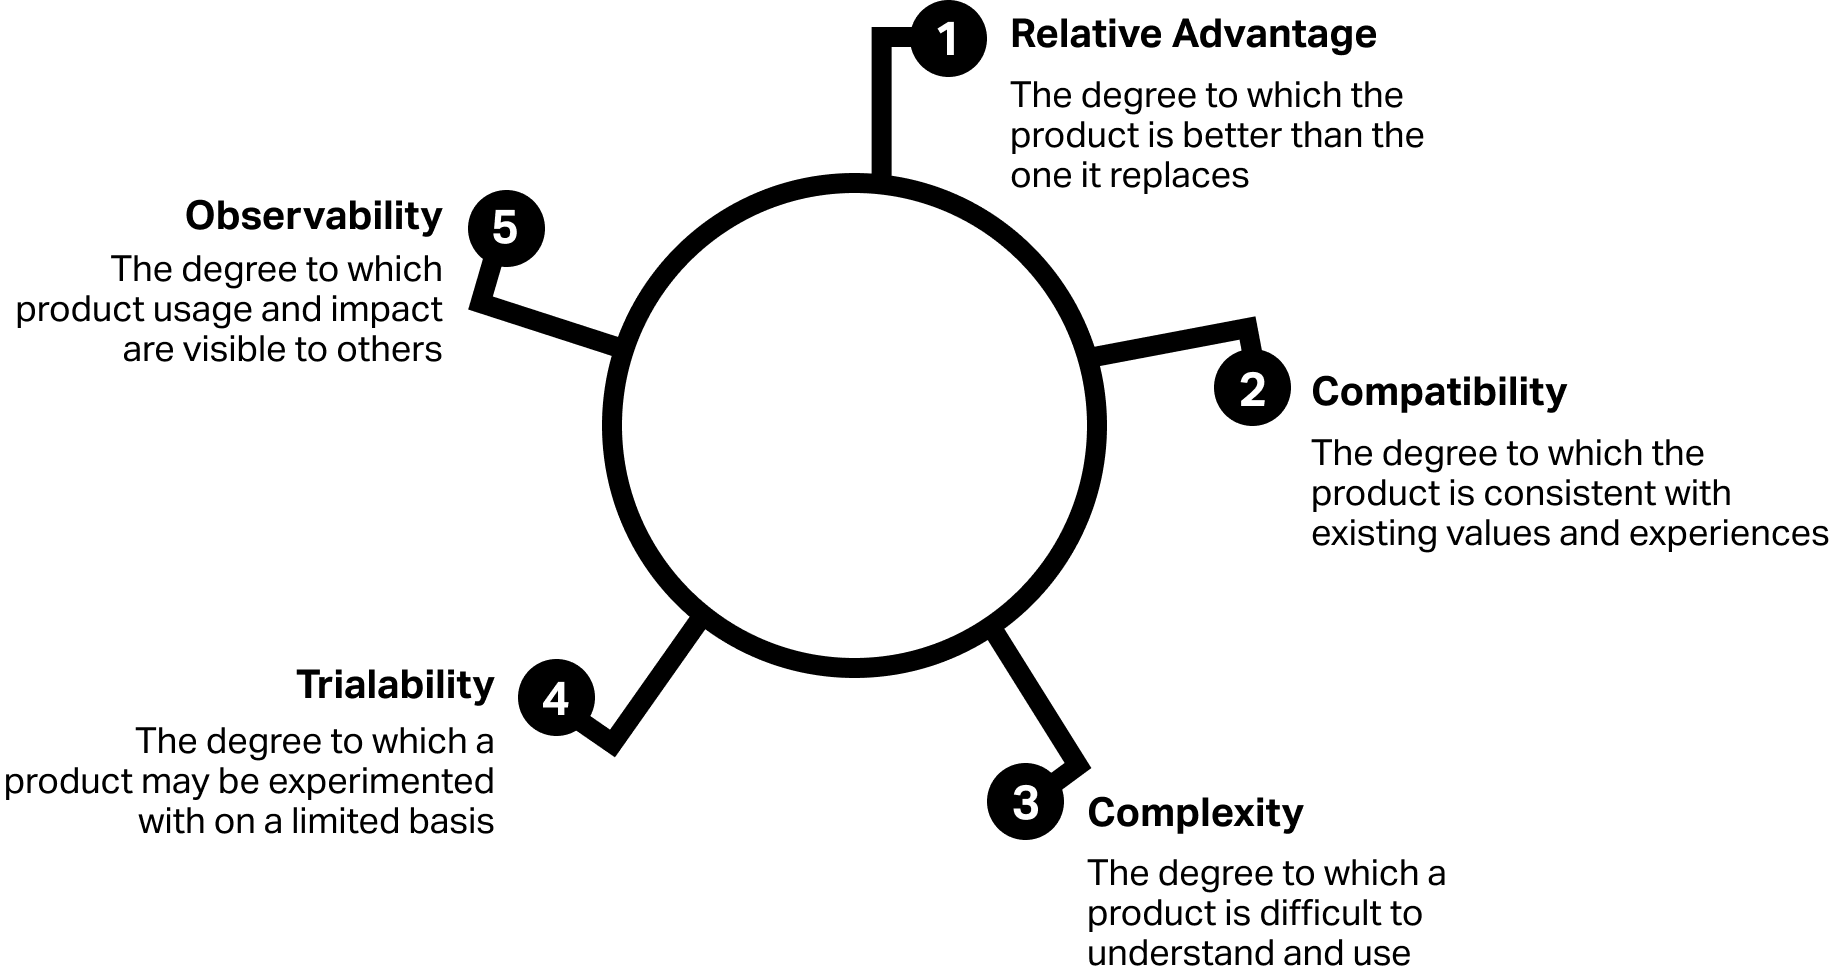
Five factors model
How can we remove the guess-work from deciding which features to prioritize?

Conjoint analysis

  • Understand what governs consumers’ preferences for product/services

  • Review basics of one of most widely used market research methods for measuring customer preferences

  • Learn how to use marketing input on preferences based on conjoint analysis to gauge market reaction to different brands (expected share) and marketing interventions (i.e. price changes)

Underlying model

  • A Product is a “bundle” of attributes
  • Consumers evaluate the alternatives in marketplace by examining how much they offer on the various attributes and how critical each attribute is to them
  • Total Value of product = sum of sub-values (partworths) of its attribute levels to the individual
  • A consumer prefers the product that delivers the greatest Total Value to him/her
  • Value of product = sum of value of each sub-part

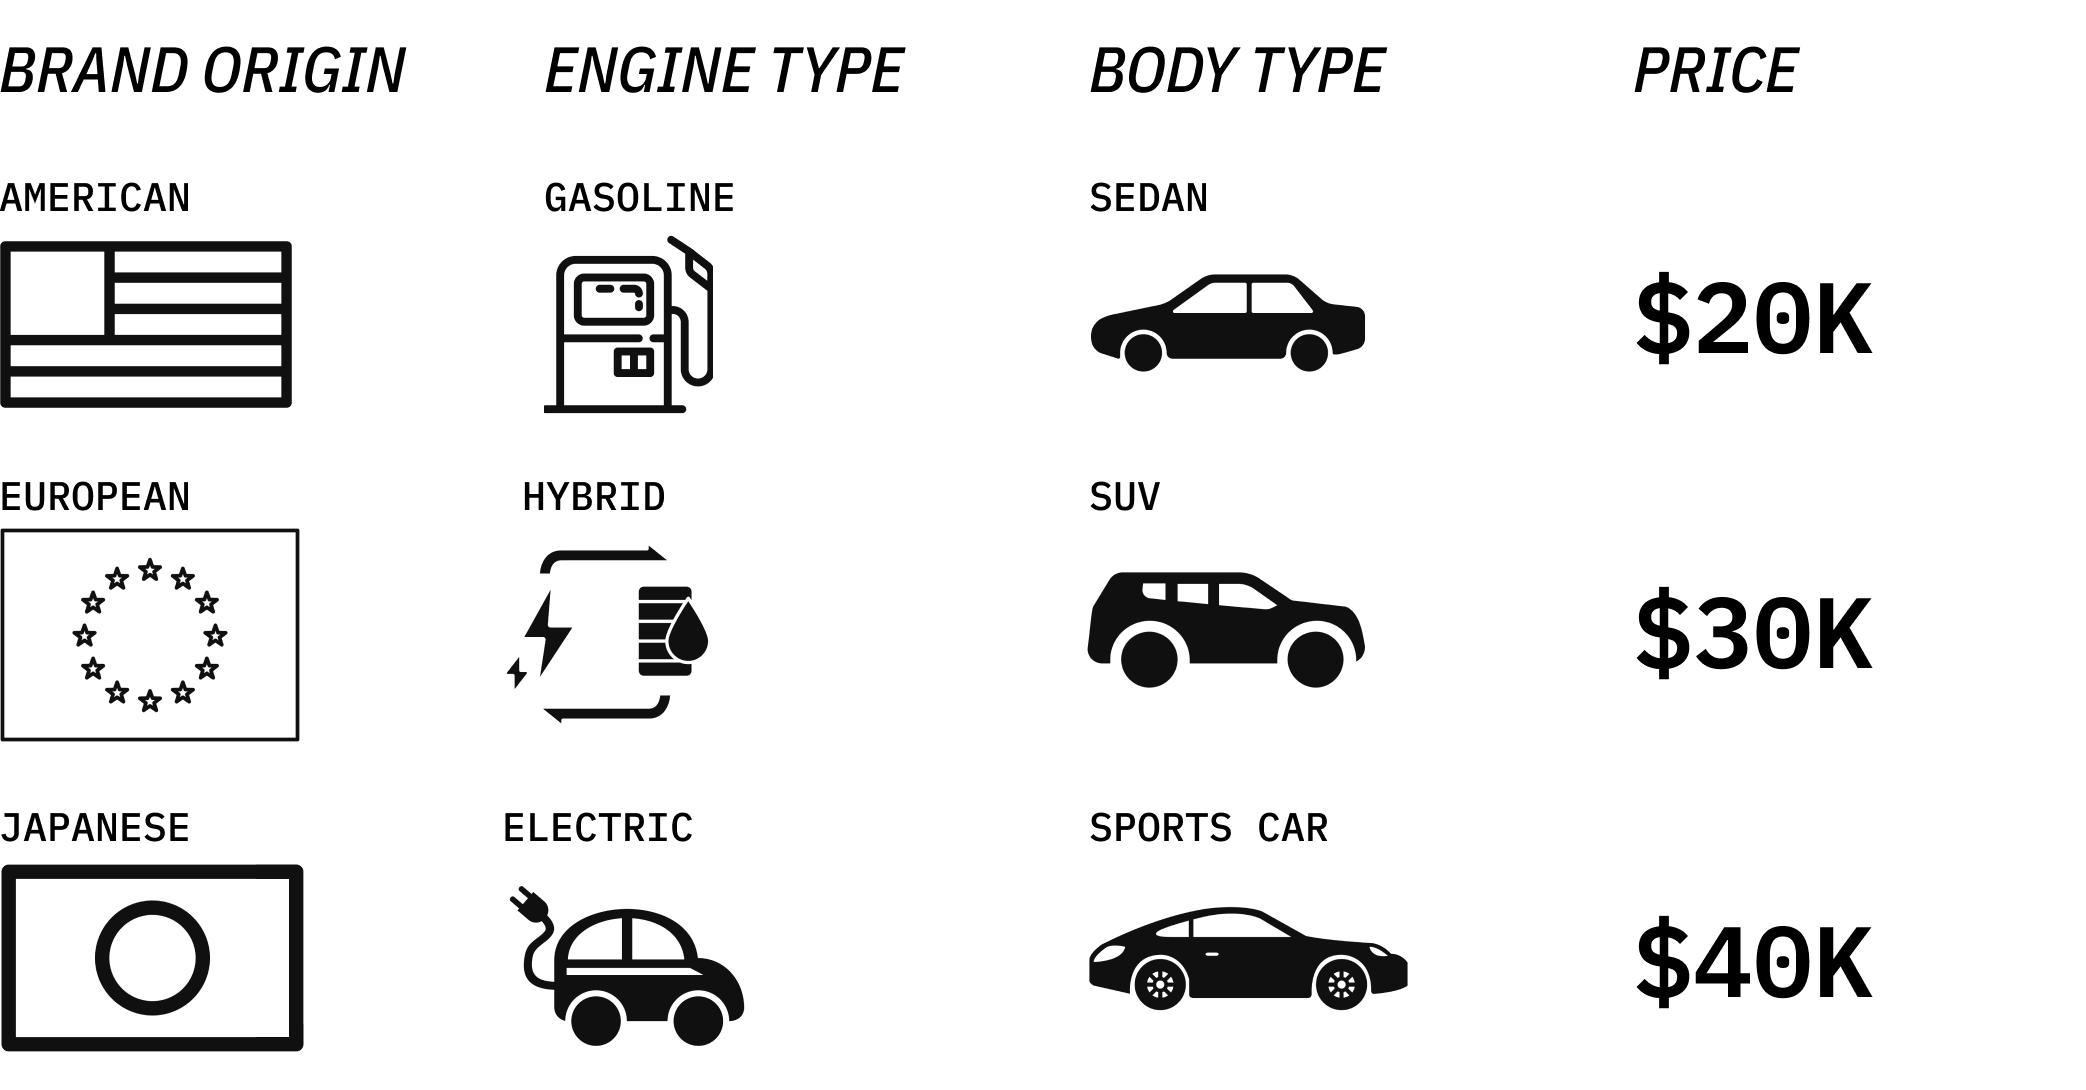
Attributes

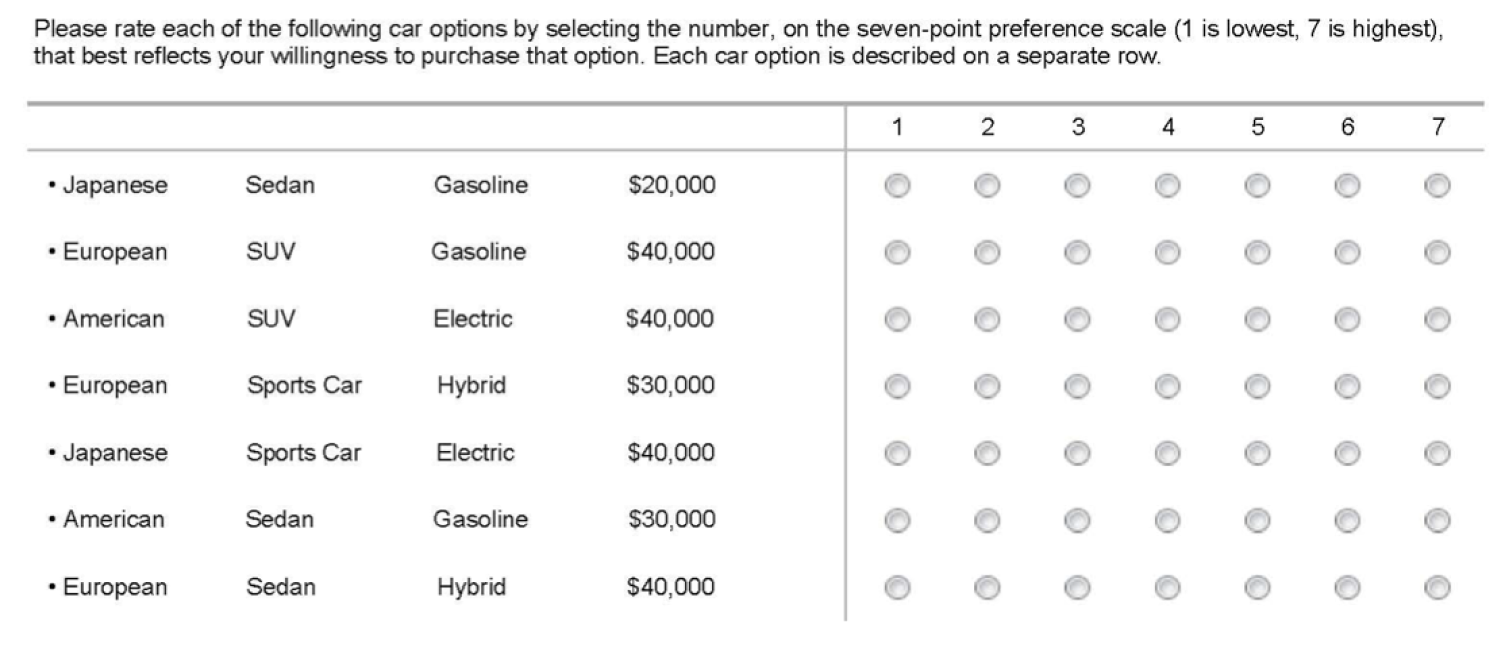
Creating Profiles

  • The more attributes and levels you have, the more options that have to be evaluated.
  • 4 attributes with 3 levels = 3 x 3 x 3 x 3 = 81 profiles!
  • Use efficient design (15 selected)

Analyzing data

Use simple linear regression to calculate part-worths for attribute levels. You’ll need to create a “baseline” profile
(i.e. Japanese Sedan Gasoline $20K).

  • Part-worths for Baseline levels set to 0
  • Part-worths for other levels = deviations from baseline
  • Total value of baseline profile captured by the intercept

How do you interpret?

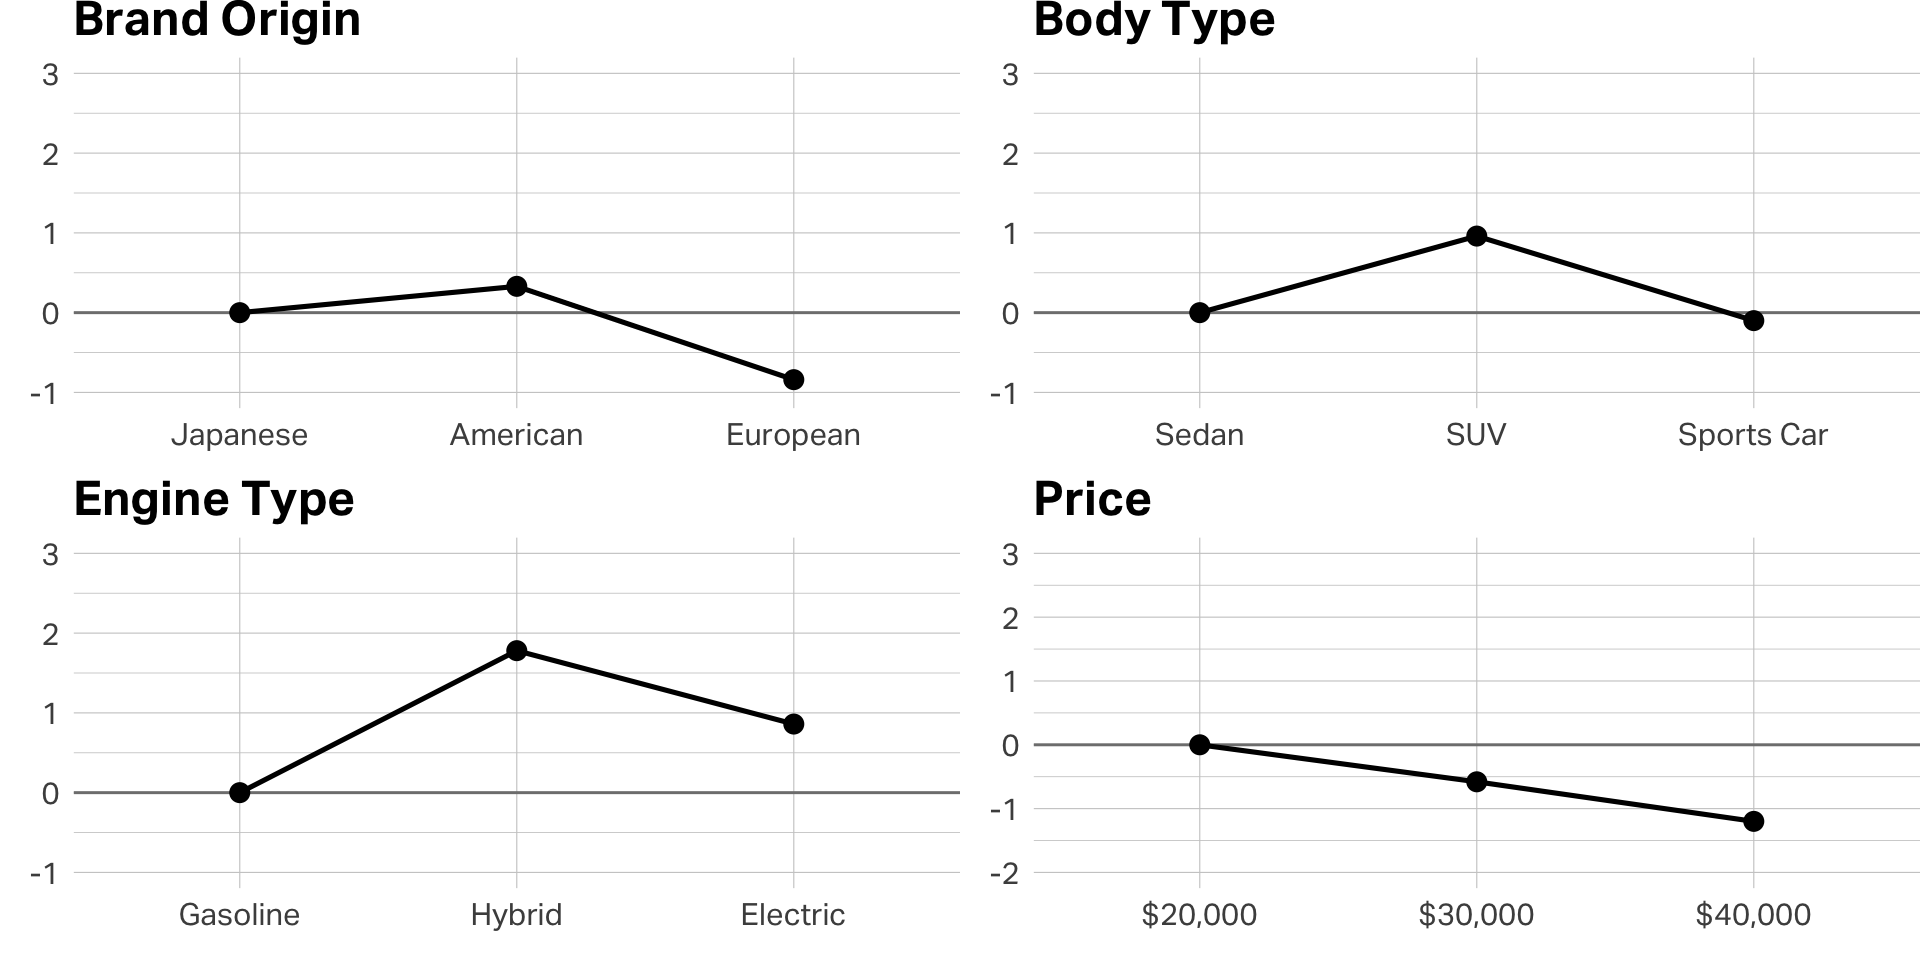
Interpreting output

Coefficient Estimate
Intercept 4.20
American 0.33
European -0.84
SUV 0.96
Sports Car -0.10
Hybrid 1.78
Electric 0.86
$30,000 -0.58
$40,000 -1.20

Intercept = Total Value for the Baseline Option

V(Car) =

V(Japanese) +

V(Sedan) +

V(Gasoline) +

V($20,000) =

4.2 “value units”

Predicting

A. Japanese, Sedan, Hybrid, $20,000

B. European, Sports Car, Gasoline, $40,000

C. American, SUV, Gasoline, $30,000

Coefficient Estimate
Intercept 4.20
American 0.33
European -0.84
SUV 0.96
Sports Car -0.10
Hybrid 1.78
Electric 0.86
$30,000 -0.58
$40,000 -1.20

Predicting

A. Japanese, Sedan, Hybrid, $20,000

B. European, Sports Car, Gasoline, $40,000

C. American, SUV, Gasoline, $30,000

Coefficient Estimate
Intercept 4.20
American 0.33
European -0.84
SUV 0.96
Sports Car -0.10
Hybrid 1.78
Electric 0.86
$30,000 -0.58
$40,000 -1.20

V(A) = 4.20 + v(Japanese)=0 + v(Sedan)=0 + v(Hybrid)=1.78 + v($20K)=0 → 5.98

V(B) = 4.20 + v(European)=0.84 + v(Sports Car)=-0.1 + v(Gasoline)=0 + v($40K)=-1.2 → 2.06

V(C) = 4.20 + v(American)=0.37 + v(SUV)=0.96 + v(Gasoline)=0 + v($30K)=-0.58 → 4.95

Breakeven Analysis

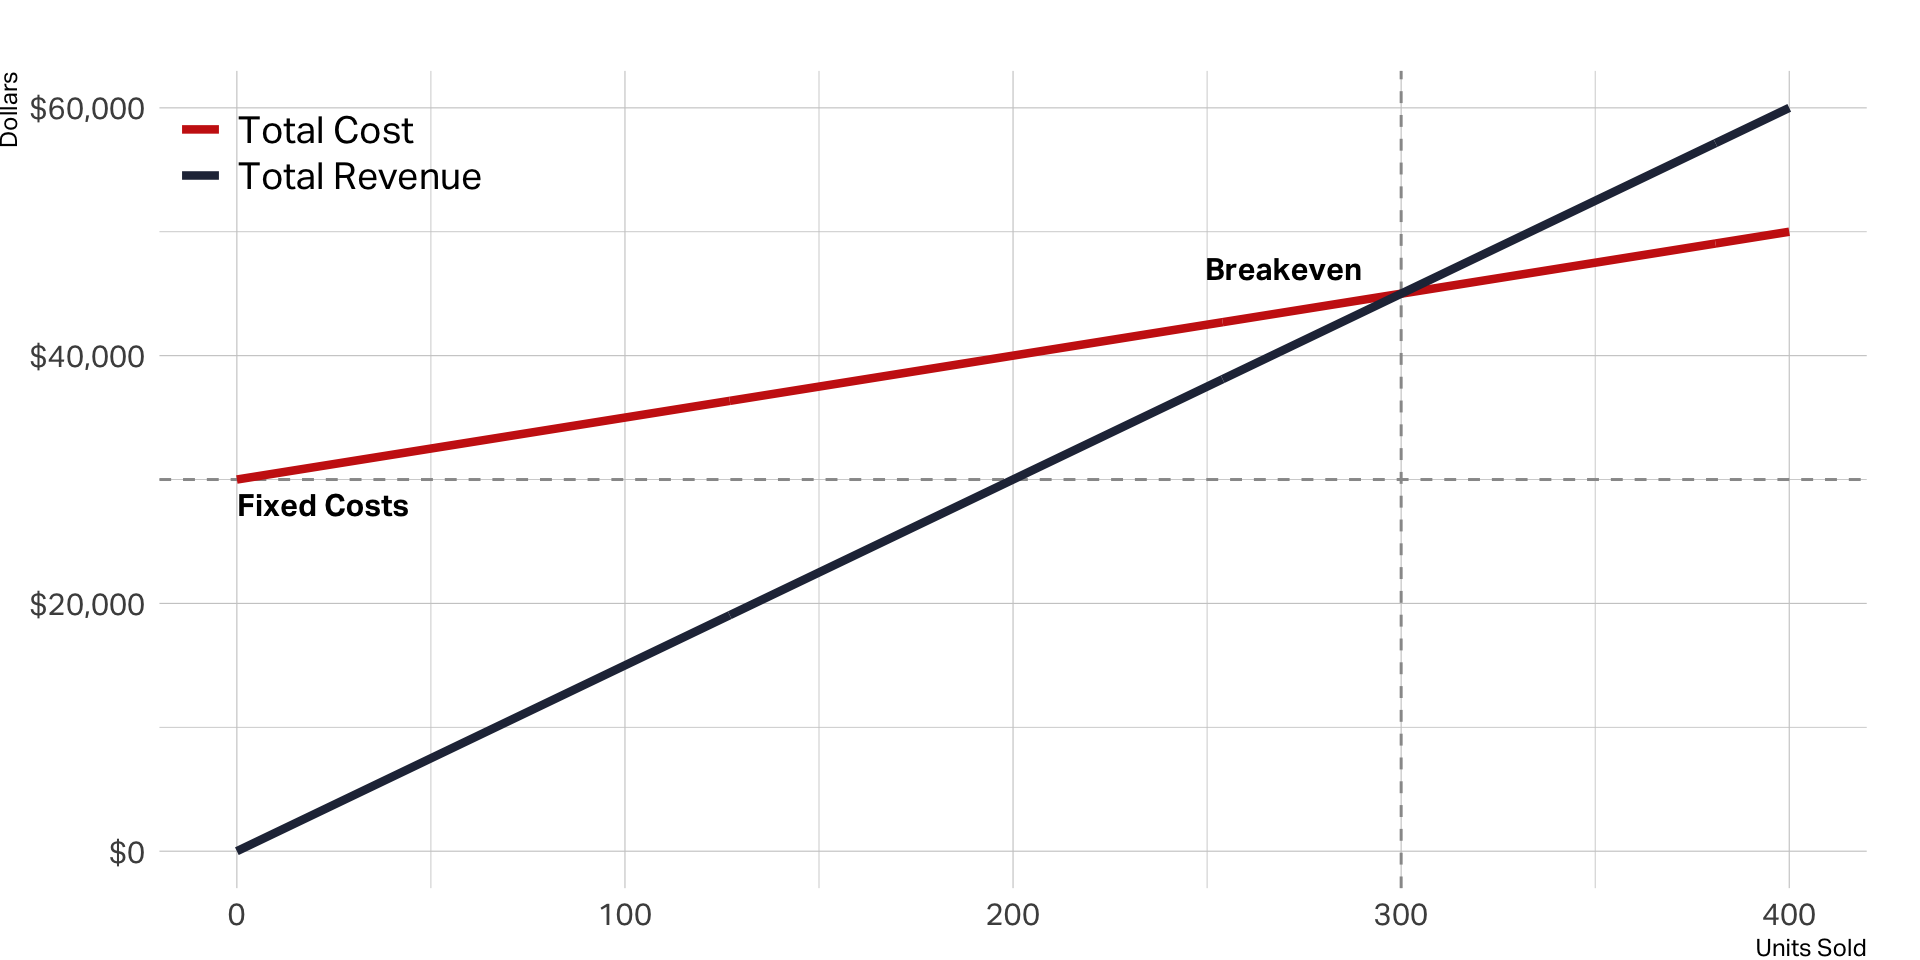
Breakeven

Factors affecting breakeven

Fixed Costs
Costs that do not change with the level of production or sales

Variable Costs
Costs that vary directly with the level of production

Sales Price per Unit
The selling price of each unit
(be mindful this may be different than the price paid by the end user)

Contribution
Difference between selling price and variable cost per unit

Output Level
The number of units produced and sold–impacts variable costs and revenue

Breakeven

  • New interactive learning toy: Professor Polarity
  • Price: $44
  • Margin: 35%
  • Initial commitment: $2.75mil

Breakout

  • Review first “Breakeven Analysis” tab on Google sheet on Brightspace
  • Examine fixed and variable costs, sales price, and output levels
  • Use the study questions at the bottom of the sheet to guide your analysis

Cannibalization scenario

  • Percy Penguin
  • Price: $28
  • Margin: 40%
  • YOY sales decline by -4%
  • Estimated cannibalization: 35%

Breakout

  • Review second “Breakeven Analysis” tab on Google sheet on Brightspace
  • Examine cannibalization assumptions
  • Use the study questions at the bottom of the sheet to guide your analysis

Takeaways

  • Design thinking uncovers what customers can’t tell you—watch what they do, not just what they say
  • Five factors predict adoption speed: advantage, compatibility, complexity, trialability, observability
  • Conjoint reveals what customers will trade off, so you invest in features that matter
  • Breakeven answers “how much do we need to sell?”—and cannibalization complicates the math
  • Innovation requires both empathy and rigor: empathize with consumer feelings, but validate with numbers